Precomputed densities and Heatmaps#
It is not possible to compute lots of Metadensity in memory. So I precompute many of them and store as files
How to send cluster script, please see scripts/run_metadensity.py and scripts/metasubmit.sh as an example
how to load precomputed data#
with the Metadensity.save_deepdish() function, you get an .h5 file that stores the density
[1]:
import deepdish as dd
import os

# let's just load 1 example
base_dir = '/home/hsher/densities'
example = dd.io.load(os.path.join(base_dir, '{}_densityarr.h5'.format('203')))
[2]:
example.keys() # it's essentially the same as the density_array
[2]:
dict_keys([('first_exon', 'left', 'rep1'), ('first_exon', 'left', 'rep2'), ('first_exon', 'right', 'rep1'), ('first_exon', 'right', 'rep2'), ('exon', 'left', 'rep1'), ('exon', 'left', 'rep2'), ('exon', 'right', 'rep1'), ('exon', 'right', 'rep2'), ('intron', 'left', 'rep1'), ('intron', 'left', 'rep2'), ('intron', 'right', 'rep1'), ('intron', 'right', 'rep2'), ('branchpoint', 'left', 'rep1'), ('branchpoint', 'left', 'rep2'), ('branchpoint', 'right', 'rep1'), ('branchpoint', 'right', 'rep2'), ('branchpoint_pred', 'left', 'rep1'), ('branchpoint_pred', 'left', 'rep2'), ('branchpoint_pred', 'right', 'rep1'), ('branchpoint_pred', 'right', 'rep2'), ('last_exon', 'left', 'rep1'), ('last_exon', 'left', 'rep2'), ('last_exon', 'right', 'rep1'), ('last_exon', 'right', 'rep2'), ('five_prime_UTR', 'left', 'rep1'), ('five_prime_UTR', 'left', 'rep2'), ('five_prime_UTR', 'right', 'rep1'), ('five_prime_UTR', 'right', 'rep2'), ('first_CDS', 'left', 'rep1'), ('first_CDS', 'left', 'rep2'), ('first_CDS', 'right', 'rep1'), ('first_CDS', 'right', 'rep2'), ('CDS', 'left', 'rep1'), ('CDS', 'left', 'rep2'), ('CDS', 'right', 'rep1'), ('CDS', 'right', 'rep2'), ('last_CDS', 'left', 'rep1'), ('last_CDS', 'left', 'rep2'), ('last_CDS', 'right', 'rep1'), ('last_CDS', 'right', 'rep2'), ('three_prime_UTR', 'left', 'rep1'), ('three_prime_UTR', 'left', 'rep2'), ('three_prime_UTR', 'right', 'rep1'), ('three_prime_UTR', 'right', 'rep2')])
[3]:
avail_uid = [f.split('_')[0] for f in os.listdir(base_dir) if f.endswith('densityarr.h5')]
Load a list of RBP collaborators are interested in#
[4]:
import pandas as pd
# read it
rbps = pd.read_csv('Final Hits.csv', header = None)[0].tolist()
[5]:
# let's see which of those have eCLIP data. the dataloader script will return what encode has
import sys
sys.path.append('/home/hsher/Metadensity/scripts/')
from dataloader import master_df, encode_data, encode4_data
[6]:
master_df.head()
[6]:
| uid | RBP | Cell line | |
|---|---|---|---|
| 0 | 203 | HNRNPC | HepG2 |
| 1 | 204 | RBFOX2 | HepG2 |
| 2 | 205 | IGF2BP1 | HepG2 |
| 3 | 206 | HNRNPK | HepG2 |
| 4 | 209 | SRSF7 | HepG2 |
[7]:
with_data = master_df.loc[(master_df['RBP'].isin(rbps)) & (master_df['uid'].isin(avail_uid))]
[8]:
with_data.head()
[8]:
| uid | RBP | Cell line | |
|---|---|---|---|
| 7 | 216 | SRSF9 | HepG2 |
| 13 | 226 | IGF2BP2 | K562 |
| 14 | 227 | SLTM | HepG2 |
| 27 | 256 | SLTM | K562 |
| 34 | 278 | PRPF8 | K562 |
[9]:
with_data.shape # so we have 46 data matching their need!
[9]:
(45, 3)
Now im gonna load all precomputed densities for the 45, and combine them into a heatmap.#
[10]:
import numpy as np
import seaborn as sns
rna = ['first_exon', 'exon', 'intron', 'last_exon']
protein_coding = ['five_prime_UTR', 'first_CDS', 'CDS', 'last_CDS', 'three_prime_UTR']
################## I KNOW THIS IS INELEGANT BUT WE STILL NEED TO SET COLORS #################
color_dict = {'5\' UTR start': 'tan',
             '5\' UTR end': 'darkgoldenrod',
              'first exon start': 'aquamarine',
              'first exon end': 'mediumaquamarine',
              'exon start': 'mediumseagreen',
              'exon end': 'seagreen',
              'last exon start': 'limegreen',
              'last exon end': 'forestgreen',

              'first CDS start': 'rebeccapurple',
              'first CDS end': 'mediumpurple',
              'CDS start': 'darkorchid',
              'CDS end': 'mediumorchid',
              'last CDS start': 'slateblue',
              'last CDS end': 'darkslateblue',

              'intron start': 'cadetblue',
              'intron end': 'darkcyan',

              '3\' UTR start': 'hotpink',
              '3\' UTR end': 'deeppink',
              'branchpoint start':'tomato',
              'branchpoint end':'darkorange',
              'machine predicted branchpoint start': 'lightcoral',
              'machine predicted branchpoint end': 'rosybrown'
     }
key_to_name = {'exon': 'exon',
 'last_CDS': 'last CDS',
 'intron': 'intron',
 'first_CDS': 'first CDS',
 'last_exon': 'last exon',
 'three_prime_UTR': '3\' UTR',
 'five_prime_UTR': '5\' UTR',
 'first_exon': 'first exon',
 'CDS': 'CDS',
    'branchpoint':'branchpoint',
    'branchpoint_pred': 'machine predicted branchpoint'}

def read_precomputed_array(uid, base_dir = base_dir):
    ''' load deep dish h5 into data structure'''
    return dd.io.load(os.path.join(base_dir, '{}_densityarr.h5'.format(uid)))
def get_feature_length(denarray):
    ''' return feature length for each feature in dictionary'''
    features = list(set([d[0] for d in denarray.keys()]))
    feature_len = [denarray[f, 'left', 'rep1'].shape[1] for f in features]
    return dict(zip(features, feature_len))
def merge_two_reps(denarray, features = rna):
    ''' merge two rep, return mean density'''
    all_mean = []
    for f in features:
        for align in ['left', 'right']:

            rep1 = denarray[f, align, 'rep1']
            rep2 = denarray[f, align, 'rep2']

            all_den = np.concatenate([rep1,rep2], axis = 0) # concat into 1 array
            mean = np.nanmean(all_den, axis = 0)
            all_mean.append(mean)
    return(np.concatenate(all_mean))
def into_one_df(uids, features = rna):
    ''' given a list of uid, concat all features and data into 1 df'''
    all_vector = []
    i = 0
    for uid in uids:
        denarray = read_precomputed_array(uid)
        if i == 0:
            flen = get_feature_length(denarray)
        all_vector.append(merge_two_reps(denarray, features)) # append into results
        i+=1


    df = pd.DataFrame(np.stack(all_vector), index = uids)
    df.fillna(0, inplace = True)
    df.replace(np.nan, 0, inplace = True)

    return df , flen

def get_feat_color(features, flen):
    ''' generate color annotation for heatmap'''
    # get feature length
    colors = []
    names = []
    for f in features:
        length = flen[f]
        name = key_to_name[f]

        for align in ['start', 'end']:
            color_key = '{} {}'.format(name, align)
            names.append(color_key)
            colors += [color_dict[color_key]]*length

    return colors, names
[11]:
df, flen = into_one_df(with_data['uid'].tolist(), rna)
rna_color, names = get_feat_color(rna, flen)
[12]:
df.head() # that's what we get, row = 1 rbp, col = 1 metagene position
[12]:
| 0 | 1 | 2 | 3 | 4 | 5 | 6 | 7 | 8 | 9 | ... | 3890 | 3891 | 3892 | 3893 | 3894 | 3895 | 3896 | 3897 | 3898 | 3899 | |
|---|---|---|---|---|---|---|---|---|---|---|---|---|---|---|---|---|---|---|---|---|---|
| 216 | 0.000091 | 0.000101 | 0.000105 | 0.000115 | 0.000125 | 0.000129 | 0.000135 | 0.000138 | 0.000145 | 0.000151 | ... | 0.000003 | 0.000003 | 0.000003 | 0.000004 | 0.000003 | 0.000003 | 0.000004 | 0.000003 | 0.000004 | 0.000003 |
| 226 | 0.000082 | 0.000087 | 0.000094 | 0.000099 | 0.000099 | 0.000112 | 0.000128 | 0.000146 | 0.000157 | 0.000166 | ... | 0.000037 | 0.000033 | 0.000030 | 0.000028 | 0.000026 | 0.000024 | 0.000023 | 0.000020 | 0.000018 | 0.000017 |
| 227 | 0.000060 | 0.000061 | 0.000064 | 0.000070 | 0.000070 | 0.000072 | 0.000074 | 0.000076 | 0.000081 | 0.000083 | ... | 0.000008 | 0.000008 | 0.000007 | 0.000009 | 0.000009 | 0.000009 | 0.000005 | 0.000004 | 0.000004 | 0.000004 |
| 256 | 0.000056 | 0.000057 | 0.000061 | 0.000063 | 0.000065 | 0.000066 | 0.000069 | 0.000073 | 0.000086 | 0.000091 | ... | 0.000007 | 0.000006 | 0.000006 | 0.000006 | 0.000007 | 0.000007 | 0.000007 | 0.000008 | 0.000007 | 0.000009 |
| 278 | 0.000029 | 0.000029 | 0.000030 | 0.000028 | 0.000027 | 0.000026 | 0.000033 | 0.000033 | 0.000032 | 0.000032 | ... | 0.000020 | 0.000019 | 0.000019 | 0.000019 | 0.000017 | 0.000017 | 0.000014 | 0.000013 | 0.000013 | 0.000012 |
5 rows × 3900 columns
[13]:
ylabelnames = with_data['RBP']+'_'+with_data['Cell line']
g = sns.clustermap(df,
                   metric ="correlation", method = "complete",
                   row_cluster = True,
                   col_colors = rna_color, col_cluster = False,
                   yticklabels=ylabelnames,
                   figsize=(16, 10), cmap = 'YlGnBu', cbar_pos=(1.1, .2, .03, .4), colors_ratio = 0.015, vmax = 0.0007)
g.ax_heatmap.set_ylabel('RBPs')
g.ax_heatmap.set_xlabel('metagene position')

for label in names:
    g.ax_col_dendrogram.bar(0, 0, color=color_dict[label],
                            label=label, linewidth=0)
g.ax_col_dendrogram.legend(loc="best", bbox_to_anchor=(-0.05, 1.5), ncol=1)
g.savefig("cluster_rna.svg", dpi = 300, format = 'svg')
/home/hsher/miniconda3/envs/metadensity/lib/python3.7/site-packages/seaborn-0.11.0-py3.7.egg/seaborn/matrix.py:659: UserWarning: Clustering large matrix with scipy. Installing `fastcluster` may give better performance.
  warnings.warn(msg)

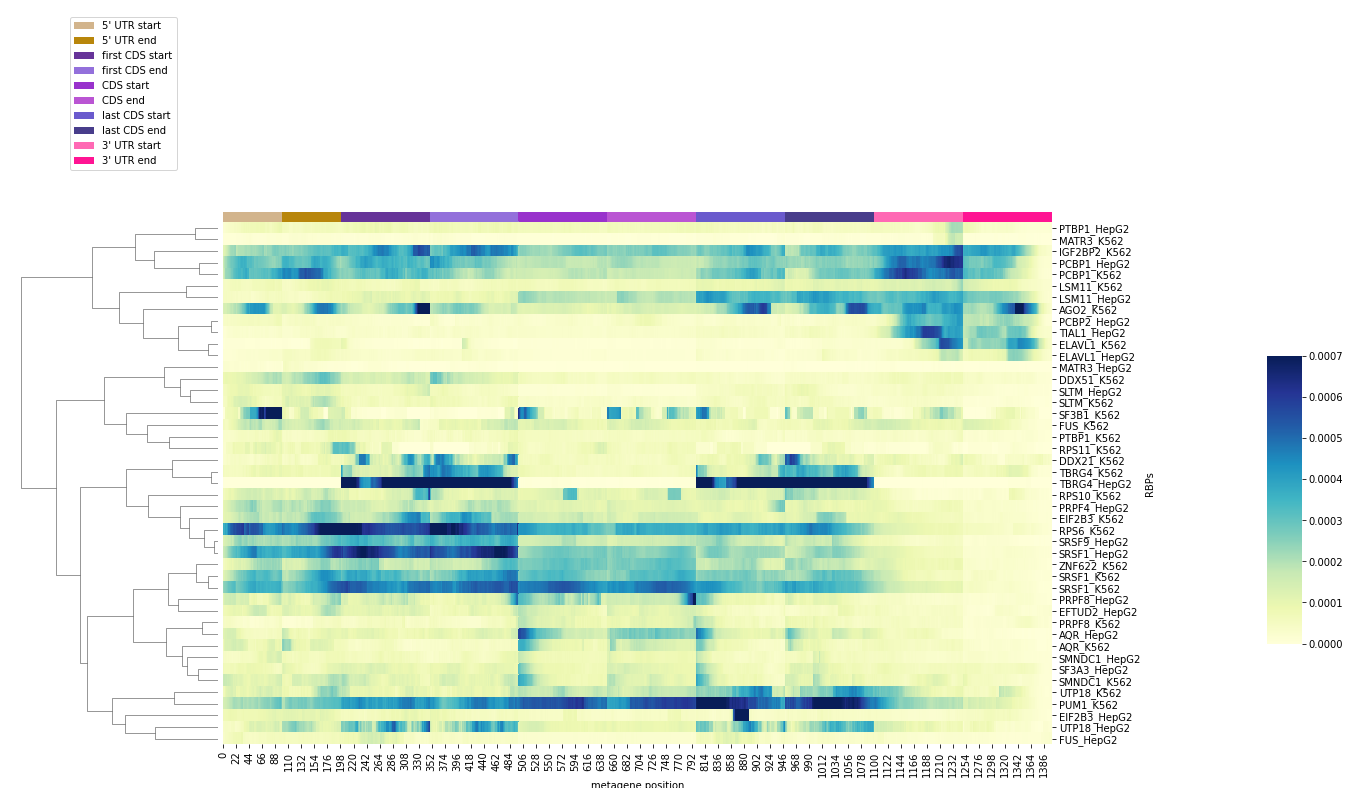
let’s do it for another feature#
[14]:
df, flen = into_one_df(with_data['uid'].tolist(), protein_coding)
cds_color, names = get_feat_color(protein_coding, flen)

ylabelnames = with_data['RBP']+'_'+with_data['Cell line']
g = sns.clustermap(df,
                   metric ="correlation", method = "complete",
                   row_cluster = True,
                   col_colors = cds_color, col_cluster = False,
                   yticklabels=ylabelnames,
                   figsize=(16, 10), cmap = 'YlGnBu', cbar_pos=(1.1, .2, .03, .4), colors_ratio = 0.015, vmax = 0.0007)
g.ax_heatmap.set_ylabel('RBPs')
g.ax_heatmap.set_xlabel('metagene position')

for label in names:
    g.ax_col_dendrogram.bar(0, 0, color=color_dict[label],
                            label=label, linewidth=0)
g.ax_col_dendrogram.legend(loc="best", bbox_to_anchor=(-0.05, 1.5), ncol=1)
g.savefig("cluster_cds.svg", dpi = 300, format = 'svg')
/home/hsher/miniconda3/envs/metadensity/lib/python3.7/site-packages/seaborn-0.11.0-py3.7.egg/seaborn/matrix.py:659: UserWarning: Clustering large matrix with scipy. Installing `fastcluster` may give better performance.
  warnings.warn(msg)
[15]:
branchpoints = ['branchpoint', 'branchpoint_pred']
df, flen = into_one_df(with_data['uid'].tolist(), branchpoints)
br_color, names = get_feat_color(branchpoints, flen)

ylabelnames = with_data['RBP']+'_'+with_data['Cell line']
g = sns.clustermap(df,
                   metric ="correlation", method = "complete",
                   row_cluster = True,
                   col_colors = br_color, col_cluster = False,
                   yticklabels=ylabelnames,
                   figsize=(16, 10), cmap = 'YlGnBu', cbar_pos=(1.1, .2, .03, .4), colors_ratio = 0.015, vmax = 0.0007)
g.ax_heatmap.set_ylabel('RBPs')
g.ax_heatmap.set_xlabel('metagene position')

for label in names:
    g.ax_col_dendrogram.bar(0, 0, color=color_dict[label],
                            label=label, linewidth=0)
g.ax_col_dendrogram.legend(loc="best", bbox_to_anchor=(-0.05, 1.5), ncol=1)
g.savefig("cluster_br.svg", dpi = 300, format = 'svg')

[ ]: